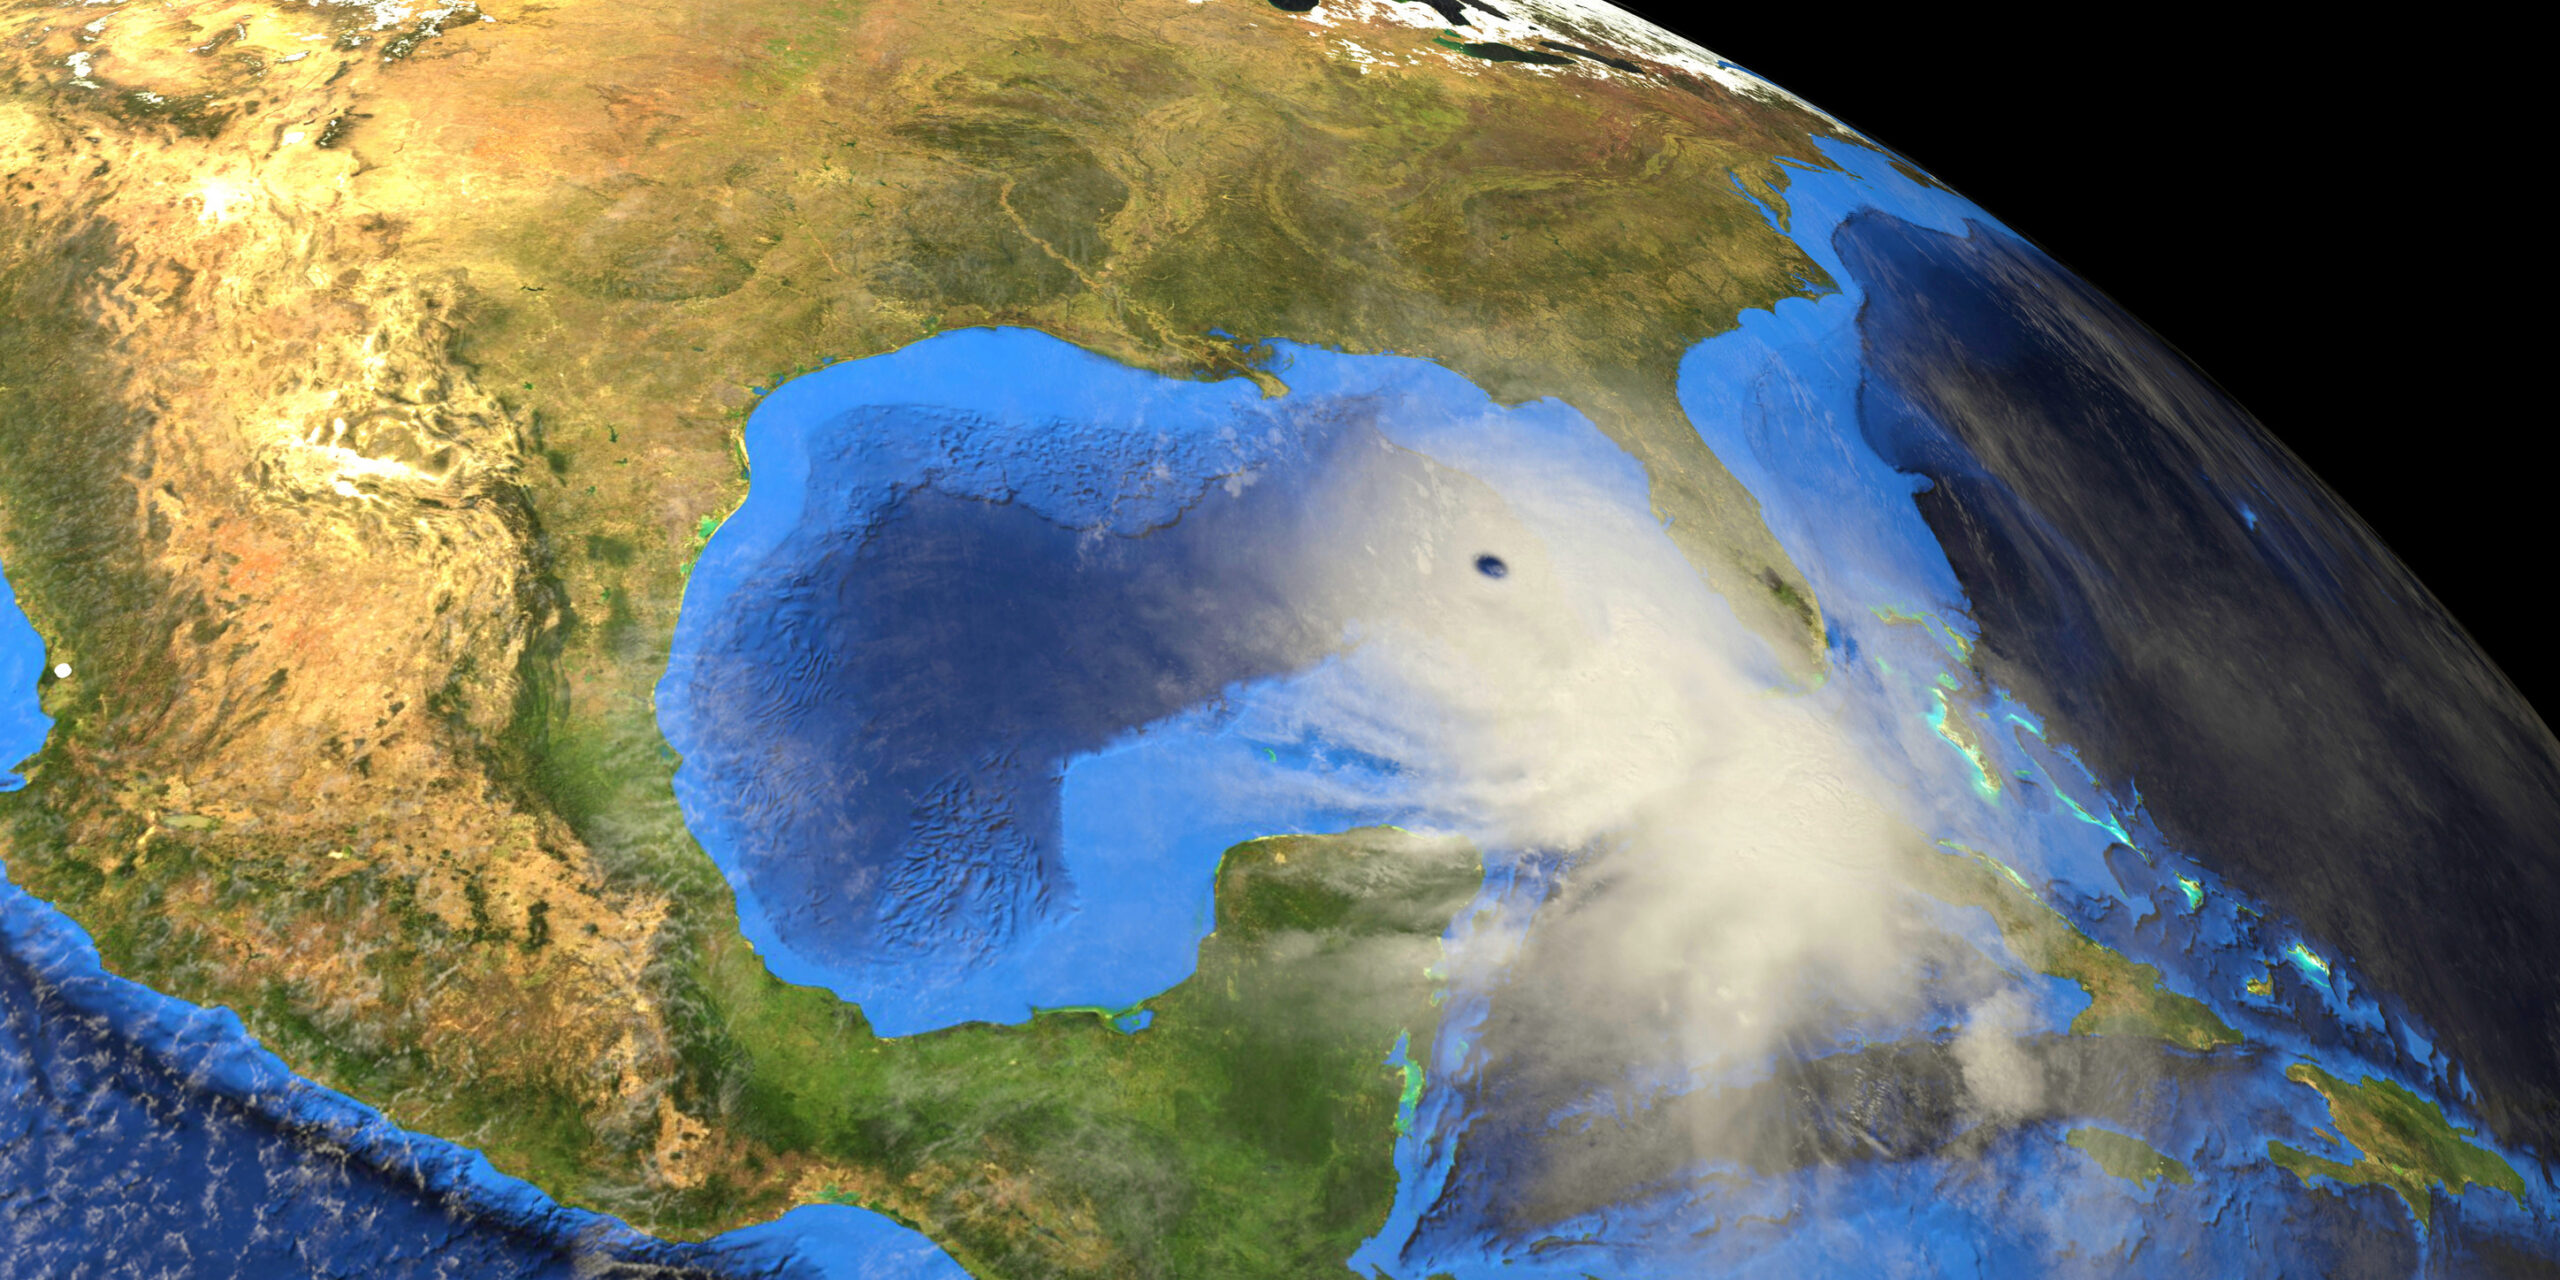


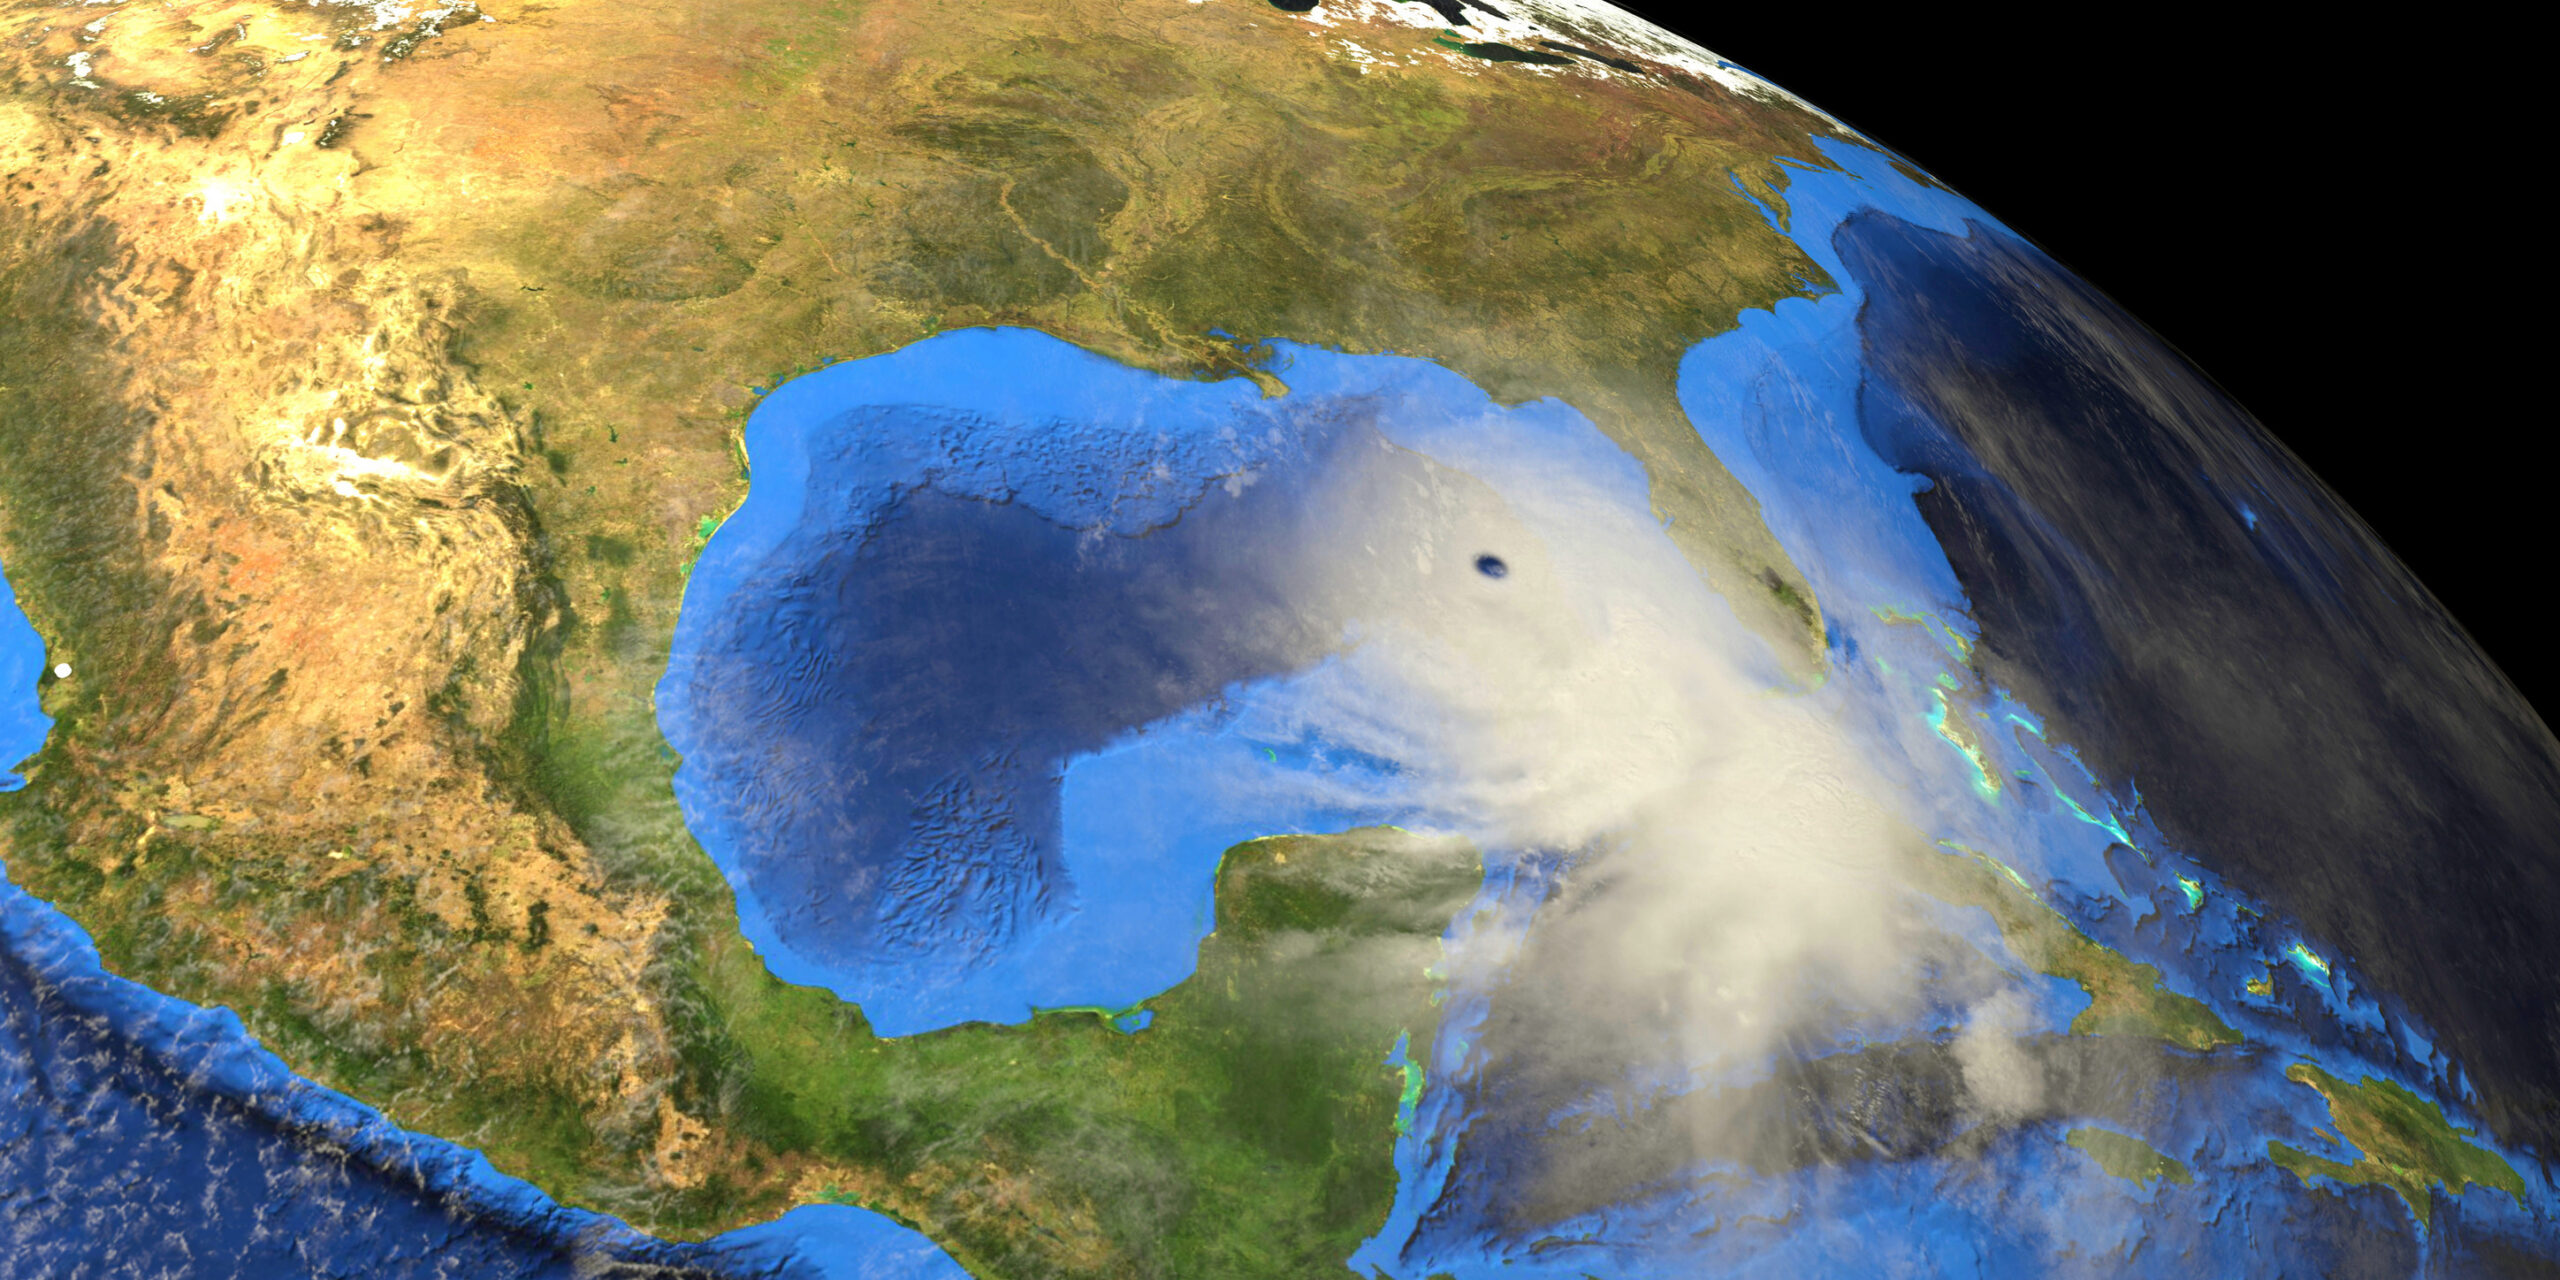
If we are going to talk about the global climate, then we must look at tropical cyclones GLOBALLY. That sounds intuitive, right? Well, you haven’t heard what’s been going on in the western Pacific (except from me, because I rant about it), which should be common knowledge when the Atlantic goes wild. If you know what is going on, you can see why the pattern can produce a year like this in the Atlantic. The ACE index is one of the lowest on record. As a percentage, it’s in the bottom 10%. But in ACE units, the western Pacific is almost 90 units below the 6-year average ACE of 301.
IOW, the average over the last 6 years out there has been as feeble as our Atlantic Basin is this year in total ACE. This is because a large-scale event is reducing, not increasing, tropical activity and intensity in the Northern Hemisphere, the opposite of what you are being told. I will show those numbers later
But first, in the Western Pacifific
Average ACE for 2019–2025: approximately 209.
The North Atlantic this year is about 100 ACE points below average ( season may not be done yet)
But the point is, the Western Pacific, the busiest basin in the world, up until this year, is averaging almost as far below normal as the Atlantic is this year
Are you aware of this?
And the Northern Hemisphere ACE index ( where most of the global ACE occurs) since 2019 is averaging 13% below normal (it’s averaged 497; normal is 571)
So the total ACE index has been significantly below average
The Ace/storm in that time is 7.4
In the previous 20 years, it was 9.04
The AI conclusion
Recent Northern Hemisphere seasons have had both fewer/less intense systems overall and less ACE generated per named storm. The drop shows up in both the seasonal totals and the intensity-duration metric.
So tropical cyclones are not getting worse
Which fits with the ideas I have put forth that the NATURE OF THE WARMING, more in higher latitudes than lower, and more poleward than toward the equator, is leading to a more stable climate
You can’t claim overall it’s getting worse if it’s not. Fewer storms globally, less intense, is not more storms and more intense. Although, with some of the things going on today, someone will argue that is not true. Fill in the blanks for your favorite example of that. is.
The media ignores this and simply pushes any big event, of which there were more before. They ignore that Western Pacific and activity has been decreasing, not increasing. You only hear about it when there is some kind of major storm.
A major balancing act is occurring here. This year, for instance, is likely to end as a record-high year for ACE in the EASTERN PACIFIC. Even when they don’t hit the US, storms contribute to wave action that can cause major flooding in Southern California. Waves radiate outward from tropical cyclones, so Marie and Rachel got out to the southwest of California, and the wave action piles up when it reaches the coast. It’s not climate change. In fact, here is Grok’s response to the question of when I first warned of what was going to happen with Rachel
September 30, 2026, is the earliest clear public statement by Joe Bastardi (@BigJoeBastardi) specifically warning that Tropical Storm Rachel would produce significantly larger waves (and related coastal impacts).
Thats a 10-day warming
The flooding is indirectly related to the strong El nino because it leads to more tropical cyclones. We knew that before the season and warned back in April that storms would hit Mexico this year. In the Atlantic, the El nino PLUS THE CONFIGURATION OF THE ATLANTIC SST has led to the down year. But the point is, someone always has a down year. What has been significant is its been mainly in the busiest basin on the planet, and its never reported on because it’s a sign of tranquility
And in the Northern Hemisphere overall, there is more down than up as the numbers clearly show
As I said, the Atlantic sea surface temperature configuration ( something we talked about in the pre-season) has alot to do with it
Look at the El nino of 2023
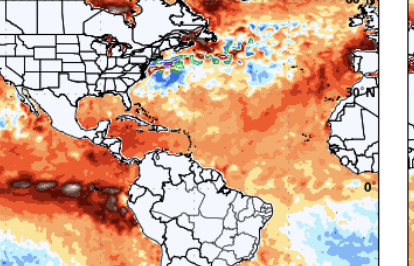

Healthy El Niño, but the water is warm through the tropics in a way that encourages development
So most of the action was out to sea; the number of storms and the ACE index were way above normal
- Named storms: 20
- ACE index: 148.2
Normal is 14 storms and ACE 123
Now look at this year
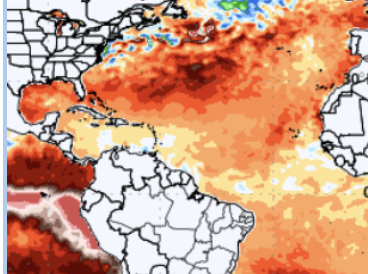

Very warm water to the north. Sure, there is a strong El nino, but we have had only 9 storms and an ACE near 20
The strong El nino of 2015 had 11 storms and an ACE of 62.7
The strong El nino of 1997 had 8 storms and an ACE of 40
This year sticks out like a sore thumb, and it’s because of the way its warming
So the way the Atlantic is warm this year is helping to cut it
Next year, we are already thinking it looks like a blend of 1998 and 2024, both high-impact years
Bottom line. The idea that tropical cyclones are becoming more numerous and more intense is the opposite of what has been happening as the Earth warms. And it points to the fact that the WAY IT’S WARMING promotes a more stable climate overall. More stable lapse rates and less zonal available potential energy are the opposite of what is needed for the anarchy that man-made global warming pushers want to brainwash people into believing ( which they have in many cases, with the aid of media with a lack of integrity to actually look at the total picture). Tropical cyclones are yet another example of this,
Go to Top
The post ACE Index reveals a DECREASE, not increase, in Nothern Hemsisphere tropical cylones. was first published by the Committee For A Constructive Tomorrow (CFACT), and is republished here with permission. Please support their efforts.