
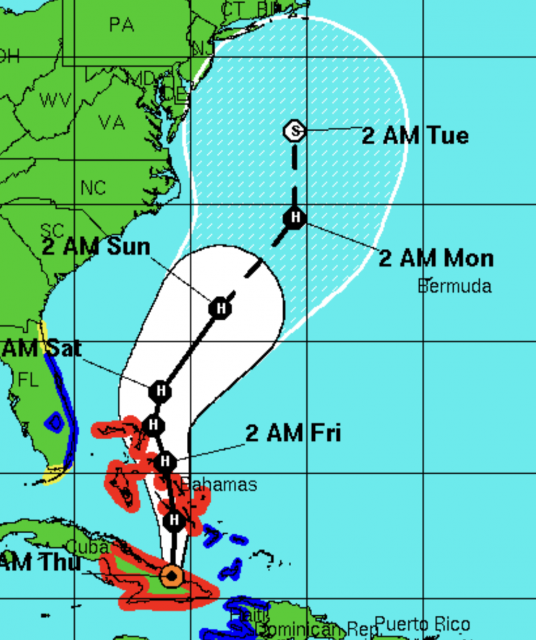
With the anniversary of Sandy, I wanted to show the evolution of our forecasts. I had Grok look at all our issuances from Oct 22. And I had it issued a summary of what was out in public the 25th. Our first warning went out the 21st. And references to past events explaining how a storm like this should happen and is natural, was also shown.
AI summary of a public post on the 25th
Context and timing
Bastardi published this on Thursday, October 25, 2012, while the system that became Hurricane Sandy was still developing in the Caribbean/Atlantic (around the time it was named or shortly after). He and WeatherBELL had already been issuing client warnings since the previous weekend. The piece is both a forecast update and a longer-term argument about why this kind of event was expected.
Core forecast and warnings
Bastardi states he had been “loudly warning” WeatherBELL clients of a historic storm in the making.
On the Sunday before the column, they put out a chart showing the system (still unnamed at that point) hitting near New York City from the south-southeast as a 75-knot hurricane early the following week.
By October 25, he had adjusted his forecast slightly south: landfall into New Jersey, with a major snowstorm on the western side from western Pennsylvania into West Virginia.
He described it to clients as a multibillion-dollar storm where it hit, and potentially the worst historically in some Mid-Atlantic coastal areas. He noted the window for it to miss was closing.
The “Philadelphia Story” scenario
Bastardi had long wondered why a hurricane from the southeast had never struck the mid- or northern Atlantic coast ( my dads idea). He routinely illustrated this in talks as the “Philadelphia Story”:
A hurricane approaches the Mid-Atlantic from the southeast, near or south of the mouth of Delaware Bay.
It drives a storm surge up the funnel-shaped Delaware Bay (analogous to what the 1938 hurricane did in Providence).
That surge meets river flooding coming downstream on the Delaware River (worsened by modern dam releases from upstream lakes).
Such a storm would also devastate the Jersey Shore worse than the 1944 hurricane.
He framed the developing event as the combination of individual past events coming together in one place. Rather than asking “why is this happening?”, he said he had always wondered “why hasn’t this happened yet?”
Seasonal and pattern context
WeatherBELL had said from the start of the 2012 hurricane season that the end of the season would feature a tropical cyclone coming out of the Caribbean and threatening the East Coast.
They expected an end-of-season pattern similar to the in-close storms that opened the season.
Three weeks earlier, they had again told clients the pattern was setting up for this.
Natural causes, not global warming
Bastardi repeatedly stressed that the storm would result from natural atmospheric processes and pattern recognition, not man-made global warming or CO2:
A tropical cyclone interacting with a massive early-season cold air mass, forcing a northwest turn into the Mid-Atlantic.
Historical precedents: his father (a degreed meteorologist) used to show him hurricane tracks and note that shifting a track by only a couple of hundred miles would produce exactly this kind of outcome. Meteorologists had recognized the setup as possible for years.
“It will not be global warming but the combination of natural events that will cause it… If it does occur, it will be because of nature, not man.”
Closing
He invited readers to WeatherBELL.com for detailed tracking (including a trial option and access to prior archives showing how long they had been setting the event up). He ended by describing the weather as “a majestic display of creation” that humans cannot control but can observe and try to understand.
Later references
Bastardi later cited this exact October 25 column (and the earlier client warnings starting around October 21) in subsequent Patriot Post pieces as evidence that Sandy was a forecastable, pattern-driven event rather than an unprecedented CO2-linked disaster. He contrasted the early WeatherBELL guidance with more delayed or different official outlooks at the time.?
This is a concise but complete rendering of the article’s content and argument.
So here are those updates ( just the maps of our tracks)
October 22nd WeatherBELL Analytics Tropical Update
October 22,2012
Right off the bat, here is the latest idea: very close to yesterday and it is the “capturing” (ECMWF) rather than escape scenario, as per the GFS.
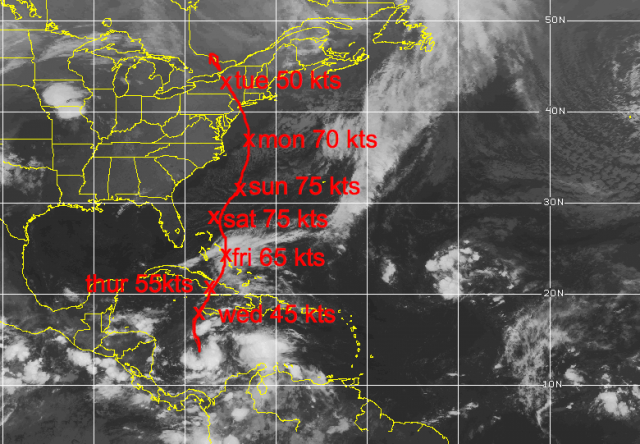


I think the capture is most likely . The “Wilma” idea of a storm is out, but new strong, non tropical is second, and the total escape last.
October 23rd WeatherBELL Analytics Tropical Update
October 23, 2012
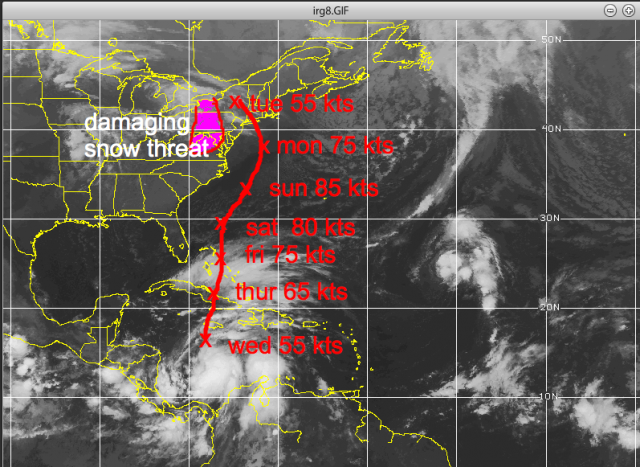
A damaging snowstorm is possible to the west of the track of this early next week in the mountains.
October 24, 2012
I have no changes in the reasoning on Sandy. The forecast if a blend of the ECMWF operational and yesterday’s idea. I will cut right to the point.

October 25th WeatherBELL Analytics Tropical Update
October 25, 2012
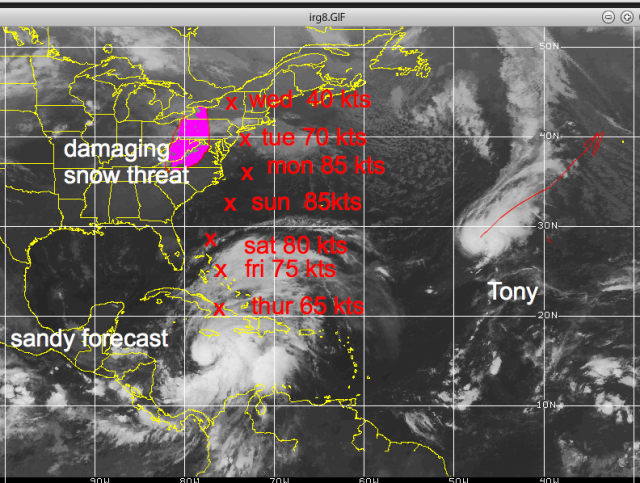
I am well aware of all the different model ideas, but my ideas on this remain the same with the forecast representing the capture option as it has from Sunday. I still list the total escape idea, but it is now 1 in 10 chance. The Wilma option remains a 3 in 10 chance, which means my idea is now 3 in 5, if we are looking at this from the idea of all 3. One has to make a forecast though, so the forecast remains the same.
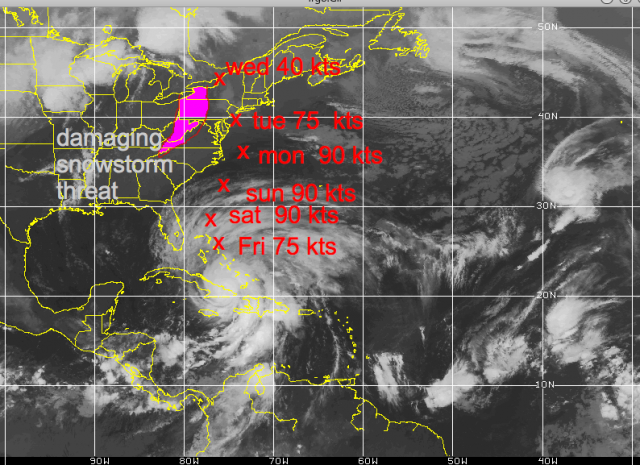
Keep in mind when this was put out the NHC track was this:


and there were other forecasts still having a complete miss
The implication here is for a 10-20 billion dollar storm, and the threat of a major disaster for the ports of PHL and ILG should the center go ashore and shove the storm surge up the Delaware Bay and flooding coming down the river. This has been something I have written on over the years, asking myself why it has not happened. Also devastated to the maximum degree would be Atlantic City as their beach faces south-southeast and is cup shaped. All the coast from Hatteras north would have hurricane winds and unlike Irene, which weakened, this would spread out true, but the baroclinic support would simply make her as powerful over a larger area rather than focused fury at the center. This will use non tropical energy sources to max out over the water, which is very much above normal.
To be blunt, it is the focusing of low level heat from the warm ocean in the very area that the coldest deviations from normal aloft are going to occur. Until nature can do her job and balance it out, the storm will deepen, then release. Crushing snows measured in feet will fall from western Pennsylvania into West Virginia, and snow may even reach secondary cities from Roanoke to Harrisburg, perhaps even into DC by the end.
Landfall Monday was at 935 mb before the weakening started.
October 26th WeatherBELL Analytics Tropical Update
October 26, 2012
I have merely adjusted the previous track a bit and the forecast is a blend of the old track, ECMWF and GFDL. The storm will re-intensify tomorrow and Sunday as it gets away from the upper feature that has captured it now. The question, of course, is where will the turn back be? I believe the ECMWF is the closest model and the landfall is half way between my idea yesterday and its 00z run, which the GFDL looks a lot like.
The “pick your poison” option is focused most heavily on the Delmarva, NJ and the threat of the major surge up Delaware Bay compounded by the river water rushing down, which could put the ports of PHL and ILG in a very bad position. A 10-15 foot storm surge is possible with this, which would inundate the coast in a way not seen since 1944 (it would probably be worse). The old GFS, if correct with the hit further north and the driving of water down the Long Island Sound while the storm surge tries to advance west, would mean NYC would have record high water. Such an event could put tunnels and subways under water. Again, pick your poison, since it seems the escape route east of the storm is out.
Given foliage still on trees, power outages equal or greater to Irene and a damage total similar or greater seems to be likely. The heavy snow area may be paralyzed for a few days, and is shown in purple.
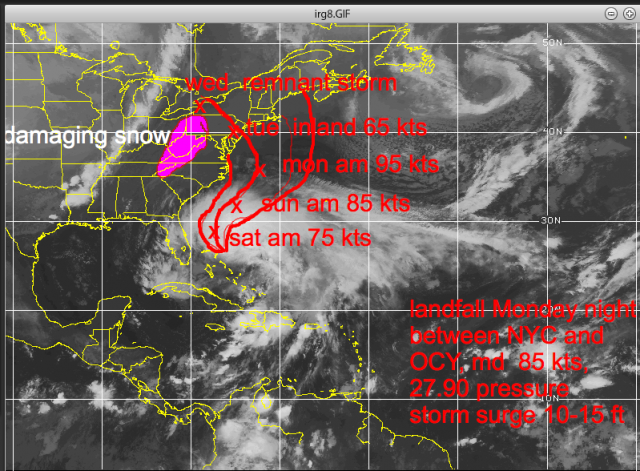
Special Sandy Update – October 27, 2012
October 27, 2012
Sandy at 967 mb rates about 3.75 out of 10 on my scale, still a hurricane. The recon has 63 kt surface winds and how a storm is downgraded with that pressure and the plane finding that surface wind without flying over every single square inch of the storm is a classroom exersise, not a realistic approach. The Power scale showed its mettle in Isaac and with Sandy as the storms “tighten” coming to land. Sandy will always have less wind, given her pressure, than a hurricane in the tropics, but with a favorable outflow and jet entrance region developing the rest of the way in and water as high as 28c this is going to redeepen IMO to at least 950, probably close to 940.
The latest track takes her inland on the central Jersey coast, north of the major disaster path for PHL but very close to the path that could lead to a devastation of Atlantic City (landfall just south). This path is also very close to the path that would lead to the unthinkable in NYC, such as has been shown at hurricane conferences, enough of a surge to put a large part of NYC underwater as sound side flooding and atlantic storm surge combine. I have gone over all these options, the path is in the middle of what is now a 7 day spread of paths that started Sunday.
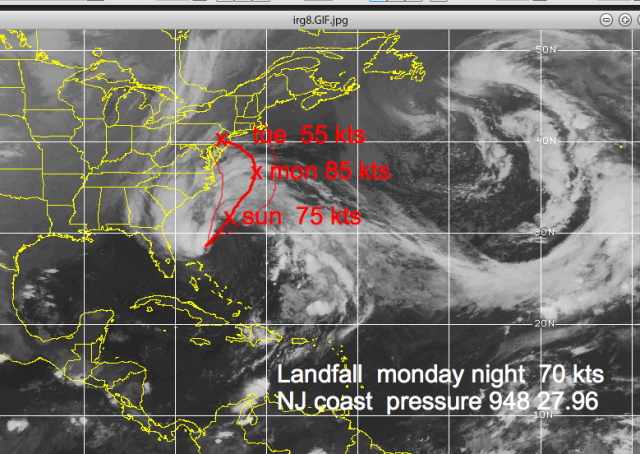
October 28, 2012
This storm will be everything said about it, and more. On my scale with pressure in mid Category 3 and wind 90% of flight level, this is a 4.85 out of 10. Its pressure is around Ike’s already and in fact, one could say this is the Northeast equal to the Ike situation, a storm that will do far more damage than what its category implies.
Naturally, I think NHC not issuing hurricane warnings and playing classification games is folly. Those things should be left for hurricane conferences, not here. But that is all I wish to say on that matter.
The track is in the mid ground of what is now an 8 day forecast period that has been given to you.
Look for the pressure to bounce up and down until the convection can get wrapped around again, but the overall idea of the intensification trend that I am expecting to see today into tomorrow appears to be starting.
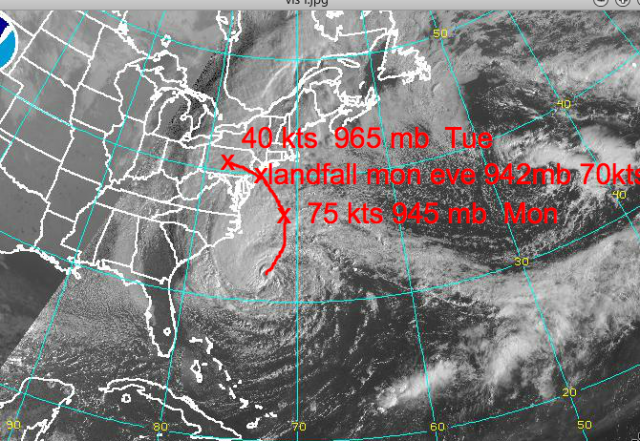

Notice back in 2012 how much size mattered.
Sandy is now rated 5.1 out of 10 on my power scale, which gives barometric pressure equal weight in assessing the storms overall capability. This idea is because the lower the pressure, even though the wind may not be in one spot, the more overall power the storm has and it also helps determine whether the storm could tighten up and wind increase as we are seeing now with Sandy. For reference, Katrina was 8.3, Ike 5.5. Last year, Irene (when it reached the Northeast) was a 4, as was Isaac this year. This is about as severe a situation as we can imagine for the Northeast areas from Delmarva to Long Island with a landfalling storm as described in the map below near Atlantic City this evening, or very close to the cumulative midpoint of WeatherBell ideas since last Sunday.

15-30 inch snows will blanket from northern North Carolina to the West Virginia mountains, though most low areas will have much less. Backlash wet flakes may make it in to DC and BWI. The snow is pretty much as outlined last week.
I expect NHC to have to up this as it comes to land and the storm surge map will have to add another layer (13-15 feet). Keep in mind the power rating from Friday was the reason I said this would have a 10-15 foot surge.
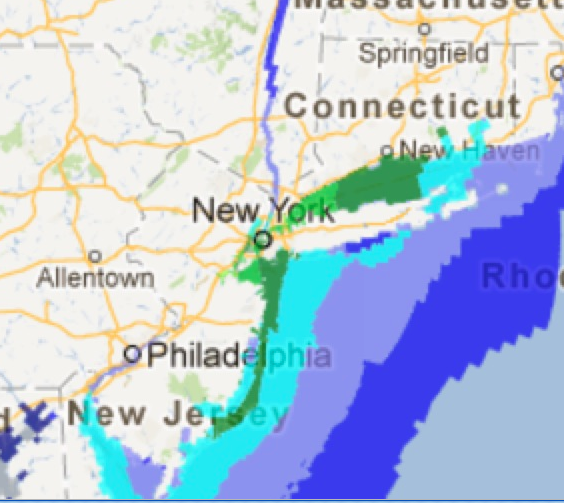

In any case, I think we can agree this was not a hype storm, but will live up to its billing.
This should shut down the hurricane season, but again you must balance out what I have forecasted as far as the sensible weather with the power outage implication vs the cold. This will cause more damage than Irene.
October 30, 2012
Sandy will wind down over the northeast the next few days and with the MJO moving away from its favored phases for development in the late season, the end game storm out of the western Caribbean is most likely to be just that.
The tropics should be quiet the next several days (weeks, months probably).
Obviously I will keep my eyes open.
And ominous Sandyversary. A storm 30-50 miles further south; it is the Philadelphia story. And sometimes that track should happen also. And it will have nothing to do with climate man made climate change, and everything to do what nature was made to do.
An ominous Sandyversary. A storm 30-50 miles further south; it is the Philadelphia story. And sometimes that track should happen also. And it will have nothing to do with climate man made climate change, and everything to do what nature was made to do.
Go to Top
The post An ominous “Sandyversary” was first published by the Committee For A Constructive Tomorrow (CFACT), and is republished here with permission. Please support their efforts.